Client
OMI WellBeauty
Industry
Beauty and Wellness Supplements
Platform
Shopify Plus
Partner
Valar Ecom (CRO & Shopify Experts)

OMI WellBeauty is a subscription-first DTC brand selling hair growth peptide supplements on Shopify. Its product page performed well by every standard measure, but four friction points sat in the buy box: savings shown as percentages, one-time and subscription options in one list, the strongest trust signal at the bottom of the page, and no reassurance at the moment shoppers committed to a subscription.
We built one variant that fixed all four at once and tested it against the existing page as control. It showed savings in dollars, split purchase type and size into a two-step toggle, moved the key trust signal beside the product title, and added an in-card checklist covering cancellation, free shipping and gifts. No redesign, new theme, or tech stack changes.
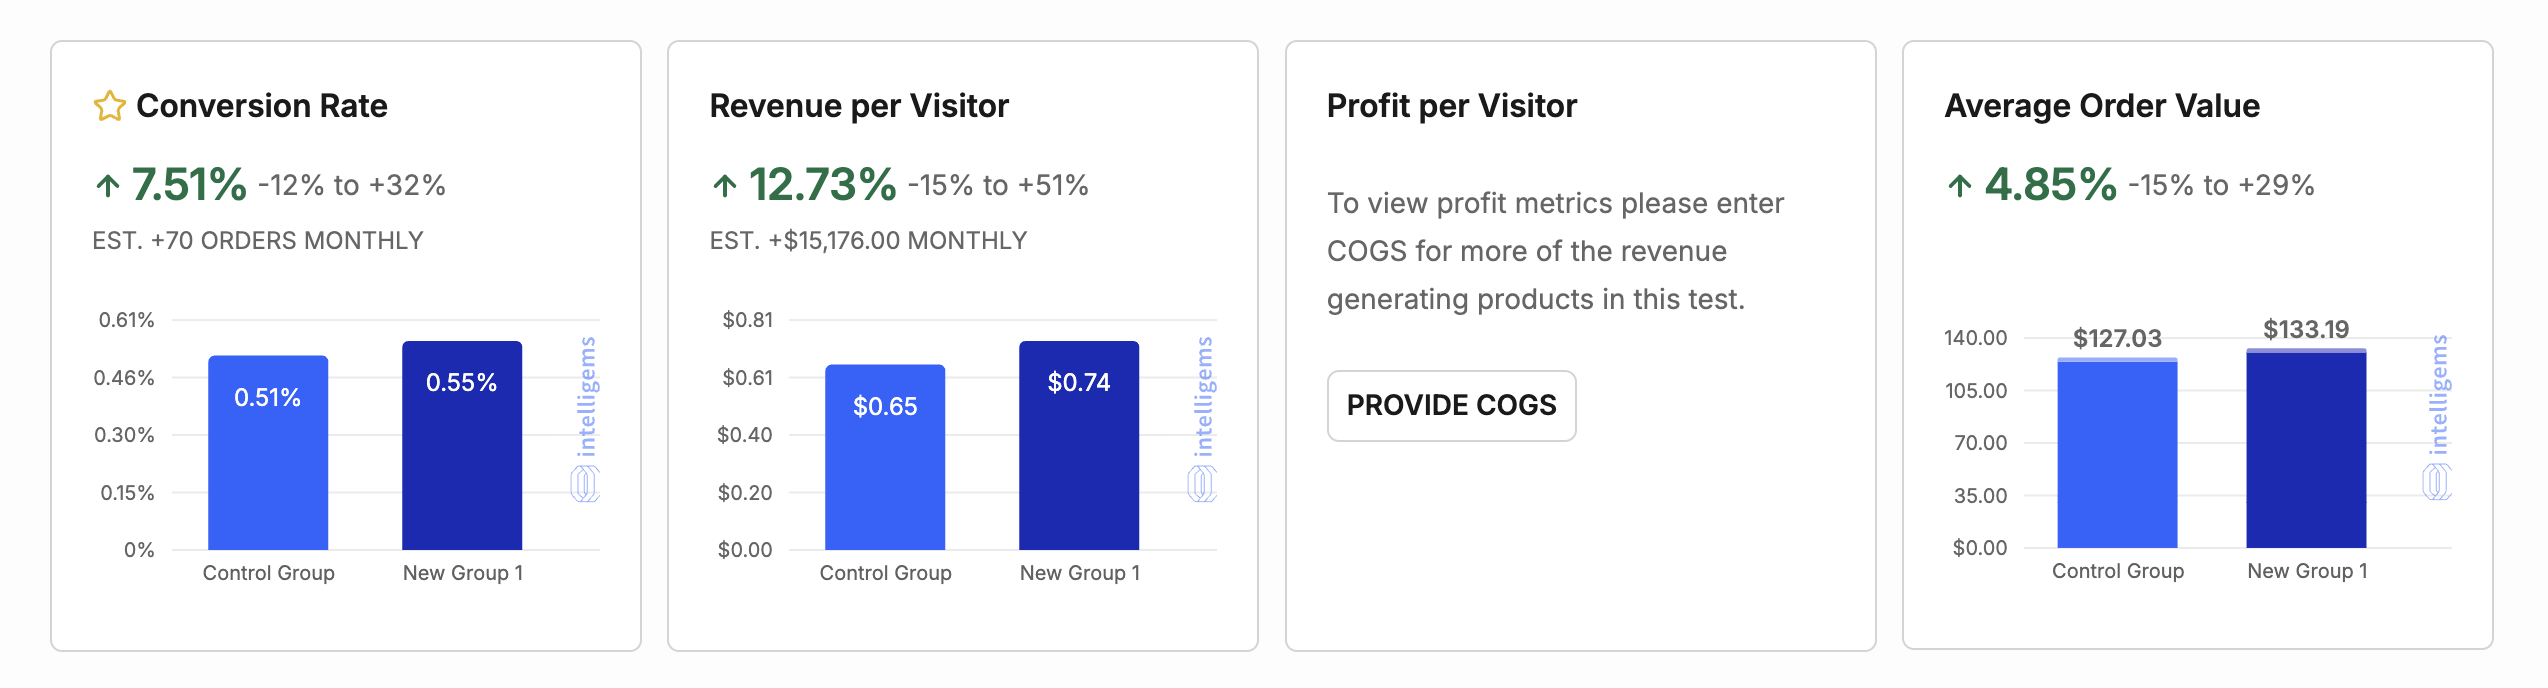
Fixing four friction points lifted revenue per visitor, conversion rate and average order value, and more shoppers chose to subscribe. Subscriptions grew from 56.6% to 59.9% of orders. Intelligems estimates the change is worth about $15,176 in additional revenue per month.
Revenue per visitor
Increased from $0.65 to $0.74
Conversion rate
Increased from 0.51% to 0.55%
Subscription orders per visitor
Subscriptions grew from 56.6% to 59.9% of orders
Estimated monthly revenue lift
$15,176 per month, Intelligems estimate
If you run a Shopify store and your conversion rate has plateaued, you’ve probably run the obvious diagnostics. You’ve checked page speed, looked for any broken checkout flows, and combed through GA4 looking for that one error stifling your growth.
After a comprehensive audit, you probably found there’s nothing wrong at all. At least not in the way a standard analytics review is built to catch. That’s exactly the case with OMI Wellbeauty.
OMI Wellbeauty is a DTC subscription brand selling hair growth peptide supplements, built around its proprietary IFP Hair Growth Peptide formula. The brand runs primarily on a subscription model through Shopify, with a one-time purchase offered as a secondary path.
By every standard measure, the site was performing fine: traffic was converting, the theme was working, and nothing looked like it was falling apart. That’s precisely what made this valuable opportunity so easy to miss.
There’s a whole category of revenue loss that never shows up as an error, a drop-off spike, or a red flag in your data. That’s when we found that the revenue was leaking. A leaking conversion is harder to catch than a page that’s obviously underperforming.
To find it, we had to stop looking at the page in aggregate and start observing how real shoppers actually moved through the purchase funnel, where they paused, where they scrolled past without reading, and where they hesitated right before a decision. Here are the four primary friction points we found:
The obvious next move would have been to test each friction point separately, isolating the variable, measuring the lift, one at a time. But that approach is slow: it means leaving three known friction points live on the page while you wait weeks for results on the fourth.
So, instead of a full page redesign or a series of piecemeal tests, we built one tested variant engineered to resolve all four friction points simultaneously, and ran it head-to-head against the existing page as control. The test ran across 34,000+ visitors per variation, a sample size large enough to have real statistical confidence in the result.
Because all four changes shipped as a single variant, the results below reflect their combined effect, not any one change in isolation. Even so, we're breaking down each one individually, so you can see exactly what changed and why.
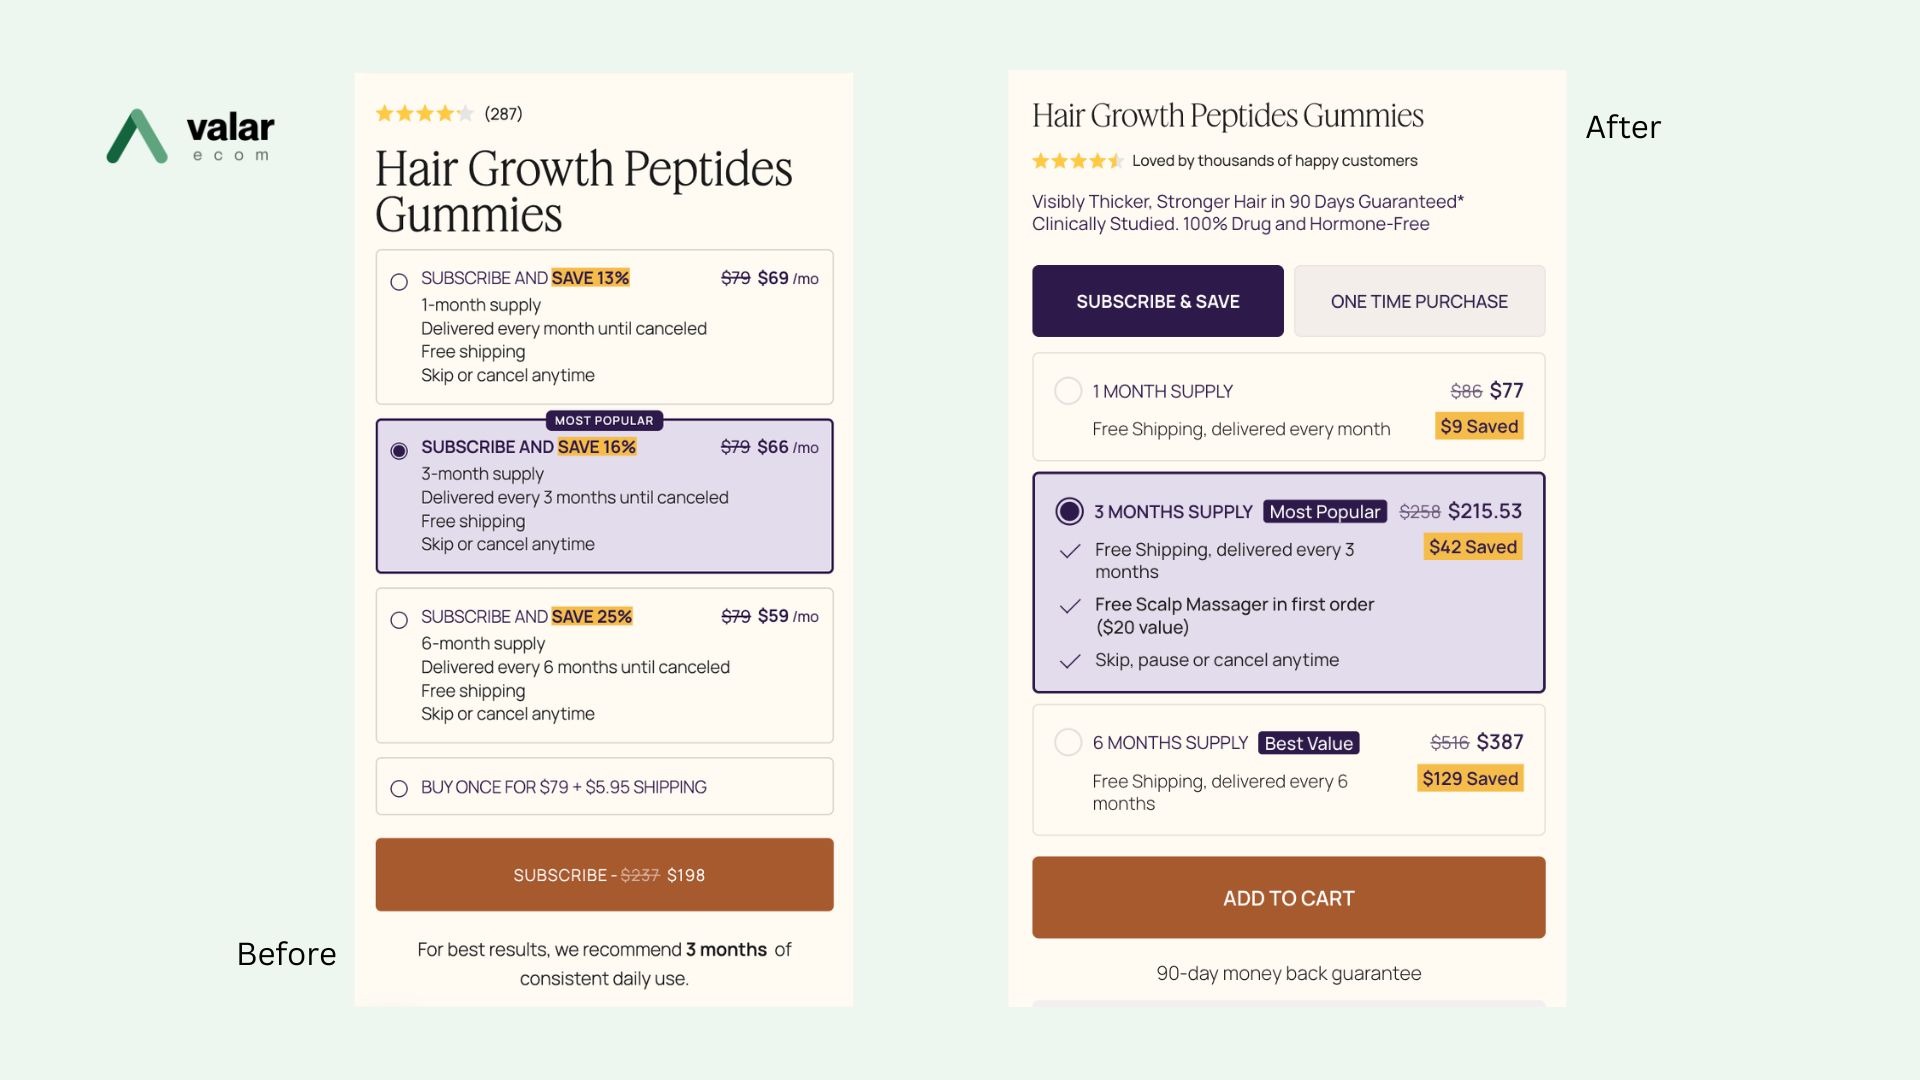
The savings selector showed percentages, not dollars. Buyers had to do the math themselves, or leave the page to calculate it.
We fixed this by replacing every percentage with a concrete dollar amount upfront. We believe the value should feel obvious, as it shouldn't require a calculator.
One-time purchase options and subscription tiers were stacked together in a single, undifferentiated list. We rebuilt the selector as a two-step toggle with purchase type first, and then the size or tier decision, so they could decide one thing at a time.
By separating these steps, each individual choice became simpler, and the path from landing on the page to selecting an option became noticeably more linear.
Clinical claims and product guarantees are the page’s most compelling content. That’s why we moved the strongest trust signal directly beside the product title, making it one of the very first things shoppers come upon when they land. Repositioning it to the top makes it visible to every shopper, not just the ones who scroll all the way down.
Buyer hesitation isn’t evenly distributed across a page. It concentrates at specific decision points. For OMI, the sharpest spike happened in the seconds right before a shopper commits to a subscription.
As a solution to this, we added a short, in-card checklist directly inside the subscription options. We clearly stated cancellation timings along with free shipping and gifts rather than addressing objections somewhere else on the page.
30 minutes, your store, clear next steps.
The combined variant beat the control on every headline metric we tracked. Both the core conversion numbers and the subscription-specific ones that matter most to a brand built on retention revenue.
| Metric | Lift |
|---|---|
| Conversion rate | +7.51% |
| Revenue per visitor | +12.73% (est. +$15,176/month) |
| Average order value | +4.85% |
| Subscription revenue per visitor | +13.95% |
| Subscription orders per visitor | +13.83% |
That last number is worth much more to OMI. This is a subscription-first brand, and the fixes didn’t just nudge overall conversion; they meaningfully increased how many shoppers chose to subscribe at all. That’s not a one-time revenue bump. That’s a compounding, recurring value that will keep paying out month after month.
All of this was achieved through four page-level changes, without any full page redesign, a rebuilt tech stack, or any new theme integration.
You don’t need a broken store to be losing revenue. You need to be willing to look at your best-performing pages with the assumption that friction is hidden somewhere, because it usually is. A few things you should keep in mind:
OMI's store wasn't broken. It had a leak, one that was quietly draining revenue a standard glance at analytics would never catch.
If your conversion rate has flattened out even though nothing on your site looks visibly wrong, that’s usually not a sign you should ignore. It’s a revenue opportunity hiding in plain sight.
Ready to utilize your store’s full potential?
Book a free 30-minute session with our Shopify and CRO specialists. Bring your questions, and we'll bring the plan.
Choose a slot that suits you and tell us a little about your store.
A focused 30-minute video call on your goals, your funnel and what's in the way.
Clear, prioritised next steps, yours to keep whether or not we work together.
Book a 30-minute session with the Valar Ecom team and leave with a clear plan to grow.
